
Fermi lAT Gamma-Ray Light Curves
The Fermi LAT Light Curve Repository (LCR) provides long-term gamma-ray light curves for over 1500 sources from the Fermi LAT point source (4FGL-DR2) catalog (Ballet et al. 2020) in the energy range between 100 MeV and 100 GeV. We offer a query of the database for Fermi-4FGL catalog events, which are included in the repository and for FLaapLUC alerts, which are associated to such catalog events.We query the database based on the following user-adjustable parameters:
- Cadence: The binning of the gamma-ray light curve. We support the three options offered by the Fermi LAT LCR: 3-day (called daily in the Fermi LAT LCR), weekly and monthly binning. We state the time uncertainty accordingly as 1.5, 3.5 and 15 days.
- Flux type: Both photon flux and energy flux measurements are provided by the Fermi LAT LCR over a standardized energy range of 100 MeV to 100 GeV.
- Index type: The Fermi LAT LCR utilizes a photon index to model the energy spectrum of a gamma-ray source. It represents the spectral shape of the source derived from its photon distribution. The user can choose between a fixed and a free index.
- Minimum test statistic (TS): The TS is a numerical value derived from a likelihood ratio test that quantifies the statistical significance of a gamma-ray source above the expected background. A higher TS value indicates greater confidence that a real source is present. The default value in the Fermi LAT LCR is 4. The user can adjust this value (with TS > 4).
Data Processing and Filtering
We retrieve the data using the /fermi_lcr endpoint (APIDOC). The data is processed using the given minimum TS to distinguish between data points and upper limits and the distance to the sun is determined for each data point and upper limit. If the distance to the sun is smaller than 20°, the point is flagged. In addition, a data validation plot is created, as described in Valverde et al. (in prep.).For this, an addtional parameter is introduced, weighted flux squared ("weighted_flux_sq"), which captures (F/δF)². This parameter is plotted against the TS for each data point (as upper limits do not have a TS) and a linear regression is fitted (in a log-log space, this equals a function of the form A ⋅ xB).
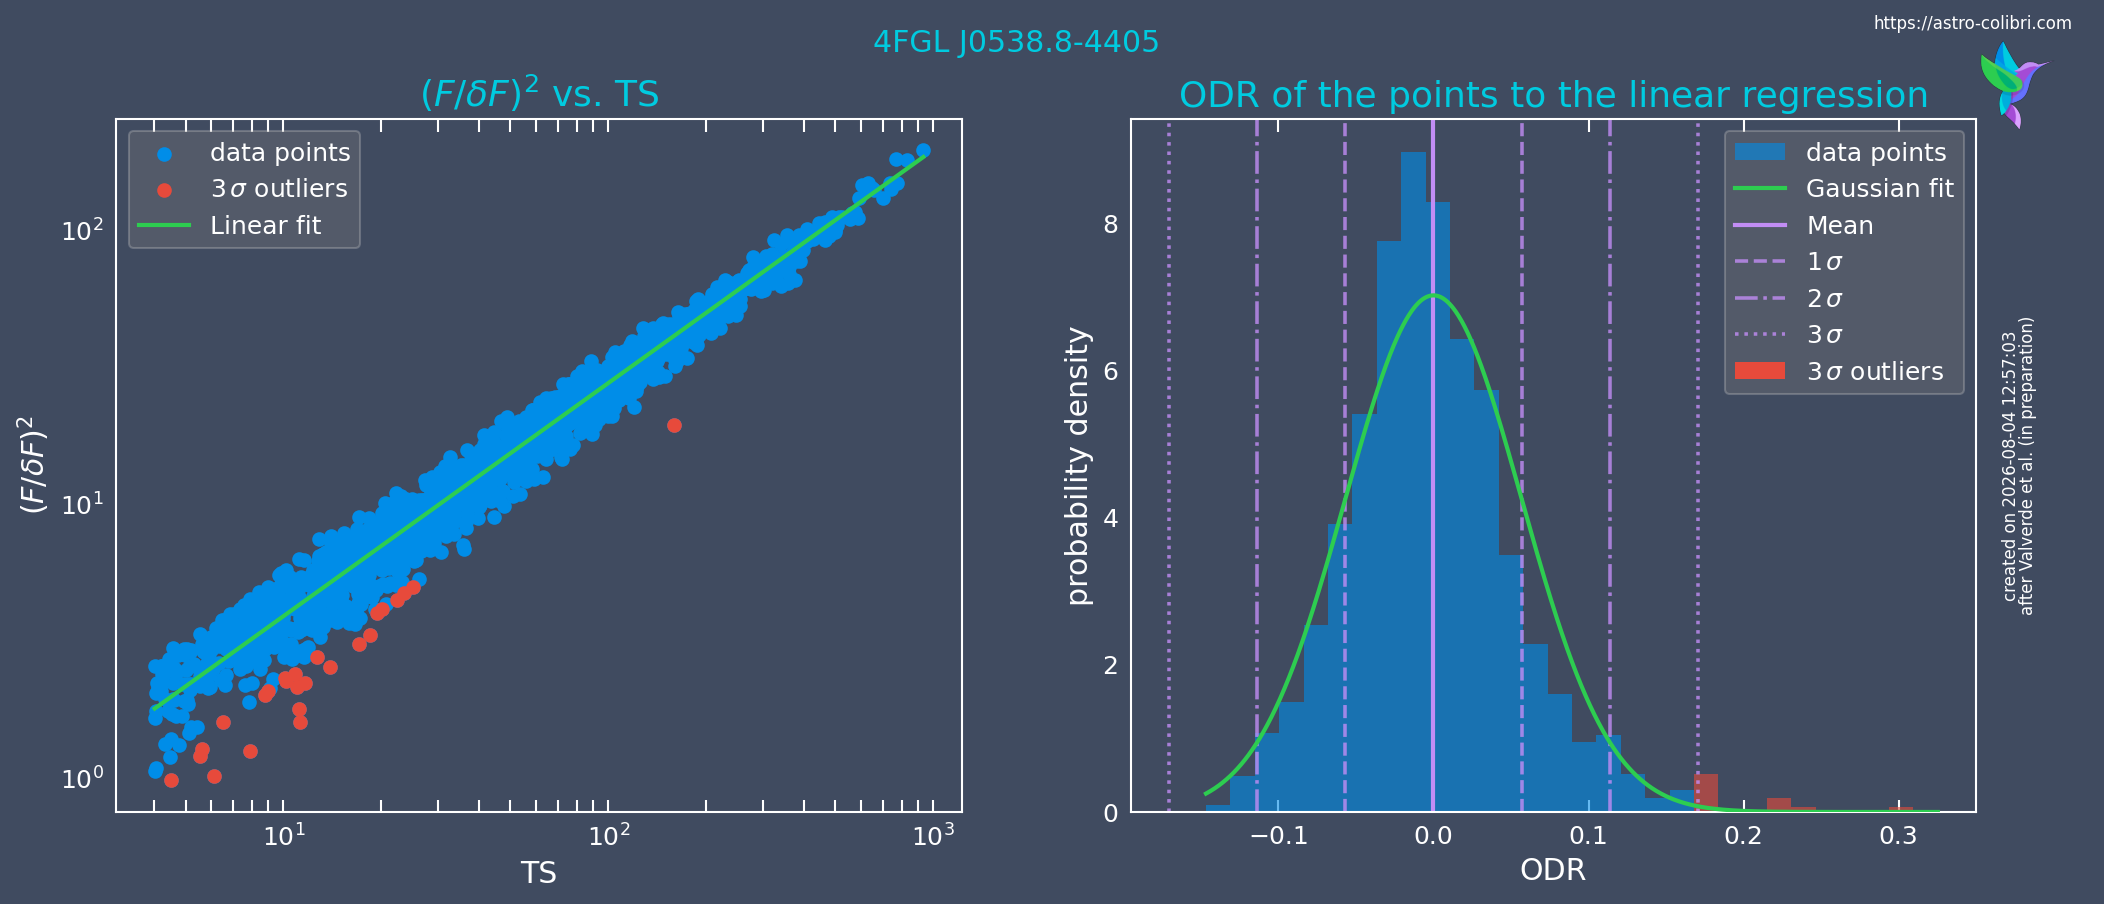
The orthogonal distance regression (ODR) of the points to the linear regression are plottet as a histogram and a Gaussian fit is performed on it. All points with at least 3σ distance to the mean of the Gaussian fit are marked as red points in the histrogramm and in the weighted flux squared vs. TS plot and are flagged accordingly. Each data point is also returned with the σ-distance to the mean of the Gaussian fit (parameter "orthogonal_distance").
Fermi LAT LCR Screen
Querying the Fermi LAT LCR for a source will return the following screen: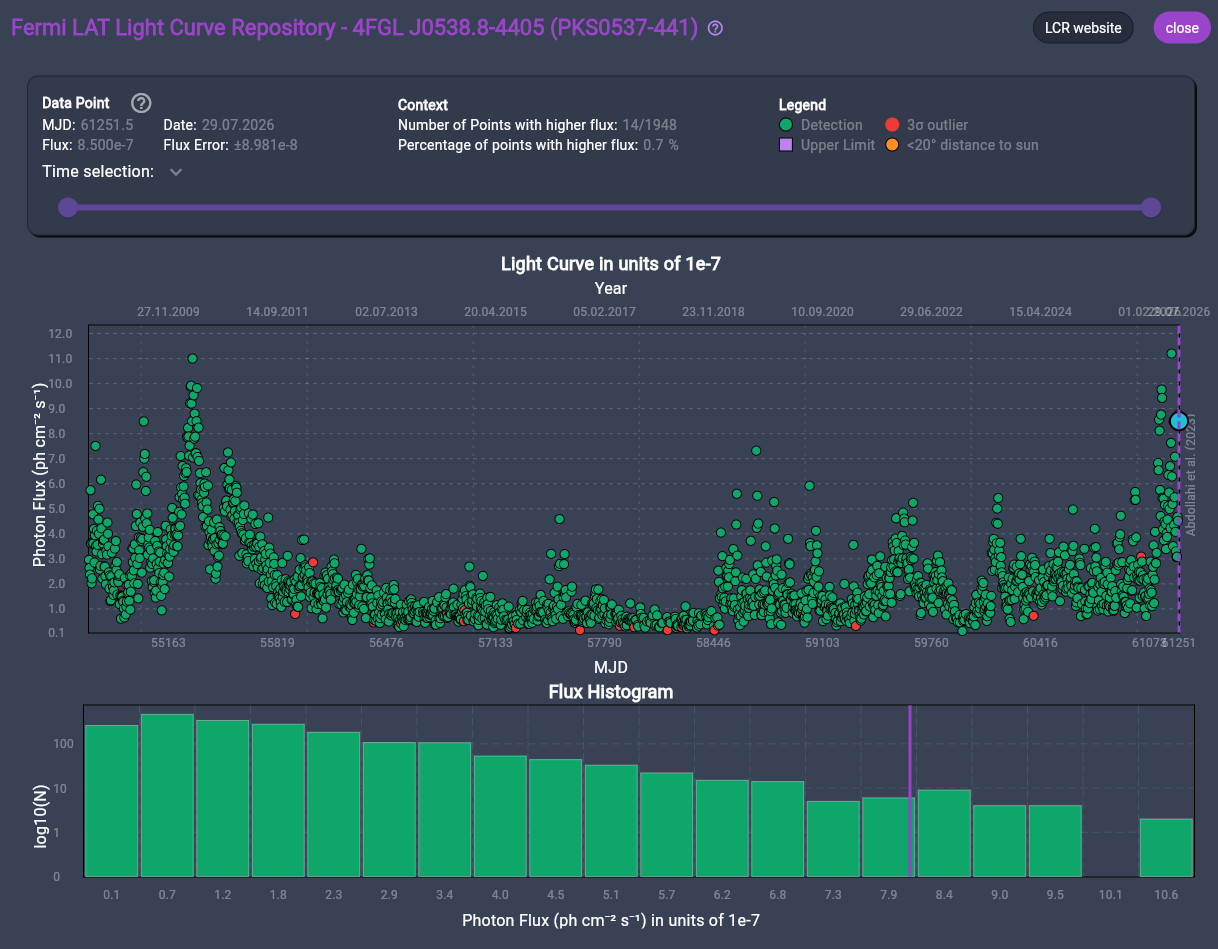
In the headline, the screen shows the source name as well as a link to the Astro-COLIBRI documentation page and the original Fermi LAT LCR website. The screen is divided into an info box on top, the Fermi LAT LCR gamma-ray light curve in the center and a flux histogram at the bottom. The info box contains information about the selected data point in the light curve (last point when the screen is opened). These are the date of the point in MJD and in the format dd.mm.yyyy, the flux and flux error and additonal context to the point in form on the absolute number of points with a higher flux and the percentage of such points. Clicking on a point in the light curve will update this information and create a vertical violett line in the histogram to pin point, which bin contains the selected point. Clicking on a histogram bin will highlight all points in the light curve, which are contained in the bin, but the information about a single data point will not be shown. In addition, the query parameters are given in this box.
The right side serves as a legend: detections are shown as green circles, upper limits as violet squares, 3σ outliers as red circles and points with less than 20° distance to the sun as orange circles. The time range for the light curve shown is adjustable via a slider or entry fields for the start and end time. Additional options for adjusting the light curve are visible when scrolling down in the info box. They contain options to show error bars, upper limits, connecting lines between points and upper limits, but also to remove 3σ outliers or points close to the sun. In addition, the data validation plot is shown and the shown data can be exported either in a csv or a VoTable format.

Further adjustable parameters are the number of bins in the histogram (default: 20), the binning shown on the y-axis, an option to remove outliers with a different σ-deviation from the mean of the histogram, and upper thresholds for data points and upper limits shown, so a flux cut from above.
-
References
- Valverde et al. (in prep.)
- Abdollahi et al. (2023), The Fermi-LAT Lightcurve Repository, The Astrophysical Journal Supplement Series, 265, 31.
-
Acknowledgements
We thank Janeth Valverde (NASA) for the fruitful discussions leading to this feature.
Further information can be found here: Fermi LAT LCR